Posts
(Formally) Presenting Search Workbench
While attending the 2018 Meeting of the Medical Library Association, I had the opportunity to present Search Workbench in a lightning talk. If you have access to the online meeting materials, you can check out the video here.
– ❉ –
Introducing Members by Interest
Members by Interest is another entry for the Congressional Data Competition.
When you examine the XML files at the GPO’s Bulk Data Bill Status page, you find that there is a wealth of data about each item, all lovingly detailed in the accompanying manual. For this project though, I wanted to concentrate on two pieces of information: who were the sponsors and cospsonsors of a given bill or resolution, and what that item was about.
The hope is to to give a sense of whether individual members of congress differ in their interests (as reflected in the bills that they sponsor or cosponsor). To quote the about page:
One member may be very interested in farming, while another concerns herself primarily with foreign affairs. It is possible to guess at some of these interests by looking at geographical region or committee assignments, but a more direct route is to examine the types of bills that an individual member sponsors and cosponsors. This is useful information not only to observers of congress, but also for citizens who are especially concerned with a given issue.
The “aboutness” of an item is determined by looking at the indexing that is helpfully provided by the Congressional Research Service. Notably, every bill and resolution is assigned a single Policy Area term that attempts to categorize what it is about in a broad sense. In addition, it is described using several different Legislative Subject Terms that give a more granular view.
The nuts and bolts are handled by a Python script that pulls policy area/legislative subject terms from a batch of Bill status records and then totals up the sponsors and cosponsors associated with each one. That data is then rendered as JSON files that get fed to a front-end that either shows a ranked list for each area/subject, such as this one for “Libraries and archives” for the 133th through the 115th congresses (Note: every sponsored bill counts for three cosponsored ones)…
…or generates a bar chart for the areas or subjects that are (proportionally speaking) most prominent in the bills sponsored or cosponsored by a particular member. For example, Rep. Clyburn (D-SC-6) has recently been an important member when it comes to items relating to the Caribbean:
…and Sen. Alexander (R-TN) has taken an interest in Animals:
– ❉ –
Introducing Committee Flow
I’ve put together a couple of new applications in response to the Library of Congress-sponsored Congressional Data Competition. The remit for this was to “…leverage that data to create new meaning or tools to help members of Congress and the public explore it in new ways.”
After spending a lot of time looking at the XML files at the GPO’s Bulk Data Bill Status page, I thought that one approach would be to do something that reflects the winding path a bill (or resolution) wends on its way from introduction to passage. It felt like a good opportunity to use a Sankey diagram, so after some poking around to make sure that nobody else had already done this with US Congressional data, I started work on Committee Flow.
The underlying architecture is fairly simple. In Google Charts, Sankey diagrams are built by defining a series of connections between points and their accompanying weights, a la
          [ 'A', 'X', 5 ],
          [ 'A', 'Y', 7 ],
          [ 'A', 'Z', 6 ],
          [ 'B', 'X', 2 ]...
Since each bill status record details which committee a bill was initially assigned to after introduction, as well as telling us whether it made it out of committee, we can count all of those connections progammatically. We can also glean whether that bill eventually passed on the floor. By summing all those counts together, we can can say that x number of bills were sent to Finance in a congress, while y were reported out and so build our diagram.
Notably, since each bill and resolution is also tagged with the policy area and legislative subject headings that it is indexed under, we can also do counts for bills about individual topics. For instance, the policy areas “Foreign Trade and International Finance”:
…or the legislative subjects “Libraries and archives”:
All the initial counting is handled by a Python script that slurps up the individual XML status files from a given directory. It’s kinda primitive, so make sure that you have only one type of status (H.R., H.Res., S. or S.Res) and one congress in each directory you are scanning. Once you have your resulting files (“sankeysubjects_114_S.js”, etc.), dump them into the designated /data directory, and you’re good to go.
– ❉ –
Tweaks to News in Proportion
I’ve done some Fall Fixin’ on News in Proportion to reflect recent changes to the Chronicling America API and make the app layout more well-behaved.
- Added Alaska, Wisconsin and Delaware to list of states mapped
- Expanded date range to 1786(!) – 1943
- Shoehorned existing layout into Bootstrap (there may be room for more tweaking here…)
– ❉ –
Same but different
Poking around in PubMed with a visual search tool such as Search Workbench can reveal an interesting pattern: different concepts sometimes perform similarly over time even though they refer to fairly distinct sets of citations.
To illustrate what I mean, let’s start with two searches that are closely related. For instance, “myocardial infarction”[MeSH Terms] is a slightly more precise rendition of “heart attack”, and both searches return very similar results:
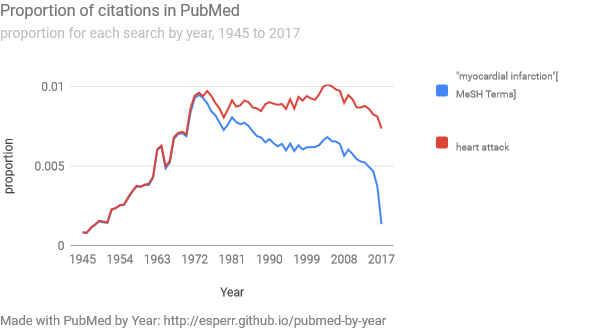
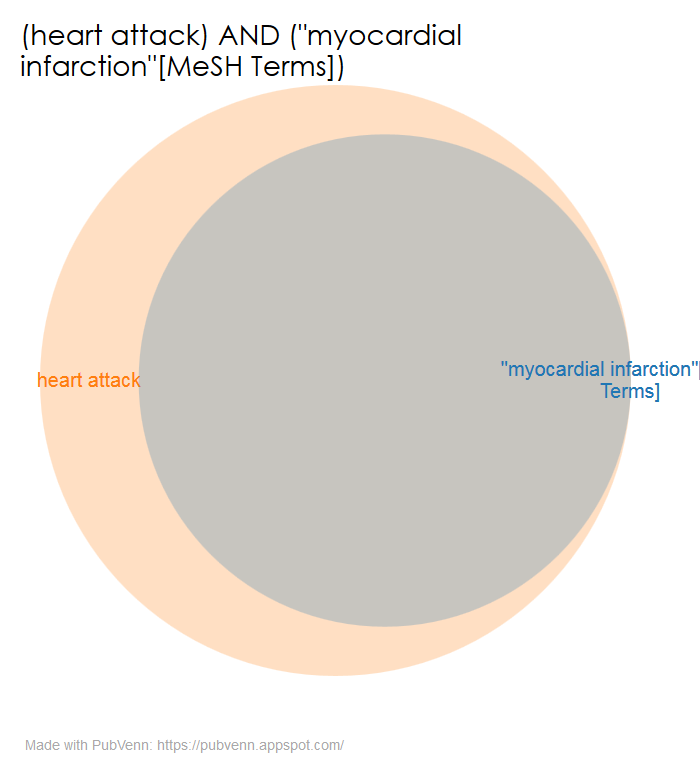
The fact that both searches are so closely aligned over time is no surprise, given that they refer to roughly the same set of citations.
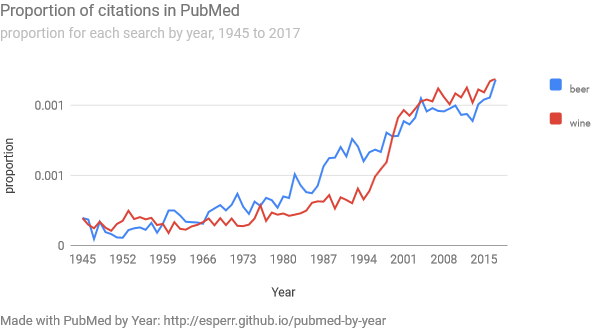
Similarly, when we do searches for “beer” and for “wine”, we also see a close alignment in terms of proportion-of-citations-by-year:
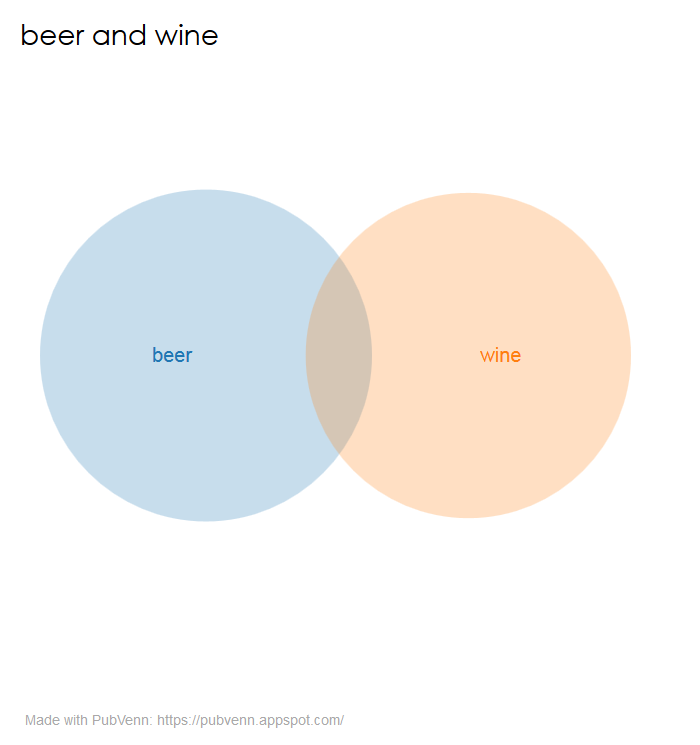
“Well,” one might think, “it is probably that there are a lot of citations for articles about alcoholic bevereges, and ‘beer’ and ‘wine’ are both terms that show up in all those hits.” Not so much:
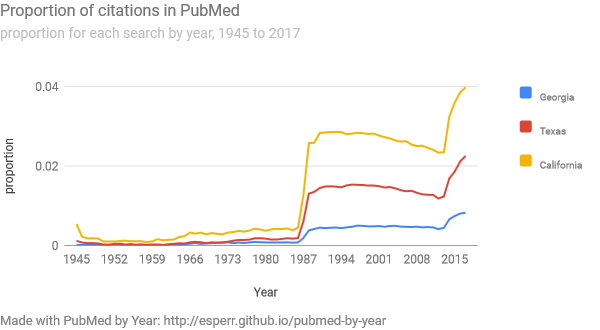
By the same token, the three states ‘California’, ‘Texas’ and ‘Georgia’ look very similar by year…
…but don’t share much otherwise:
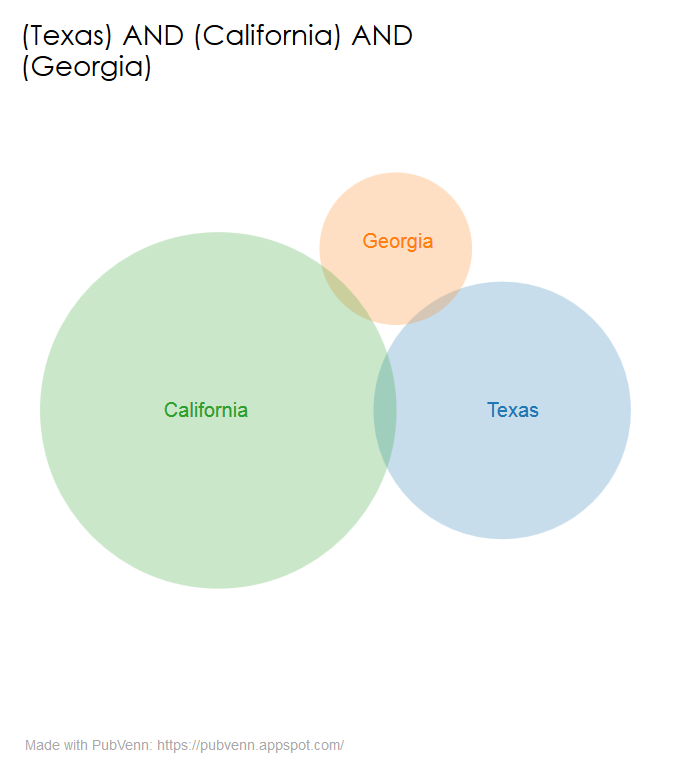
This could either be a weird one-or-two off quirk, or it could be the first intimation of a profound law of citation sets. I can’t say that I know off the top of my head, but if you do, please drop me a line: ed_sperr@hotmail.com.
– ❉ –