Introducing Collection View!
A few days back, I had the distinct pleasure of debuting my newest project, Collection View, at my talk “Looking Beyond the List: Enhancing Search with Interactive Visualizations” at Code4Lib 2021. You can find the slides for that talk at osf and the recording on YouTube.
One issue with large bibliographic databases is that many searches return hundreds if not thousands of results. Ideally, much of what a user is looking for will be concentrated in the first few dozen results, as those are likely the only results they will ever look at. Otherwise that user should revise their search, but how do they know if those changes are doing any good?
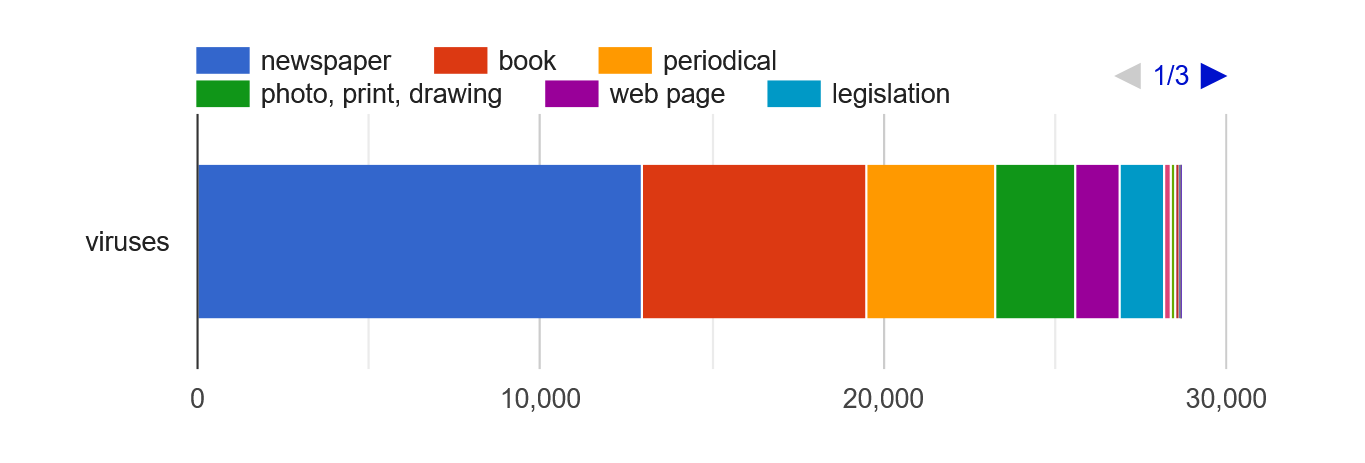
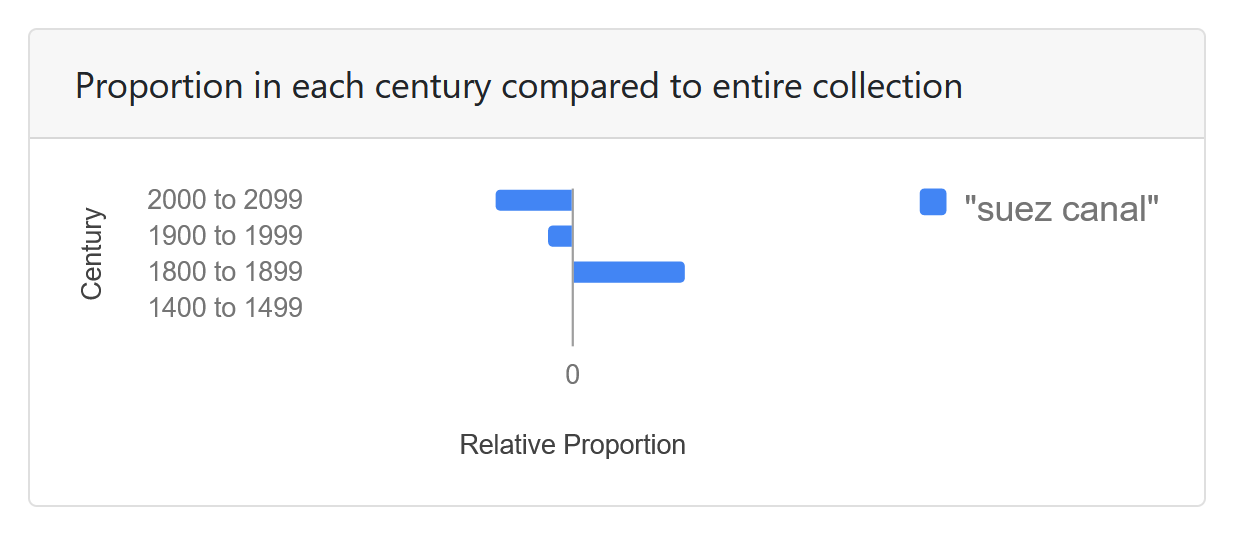
Here is where visualizations can help! Collection View is designed to translate your Library of Congress search into simple visualizations that give you an instant summary of the kinds of materials that are being returned as well as showing how their proportions compare to those of the collection as a whole.


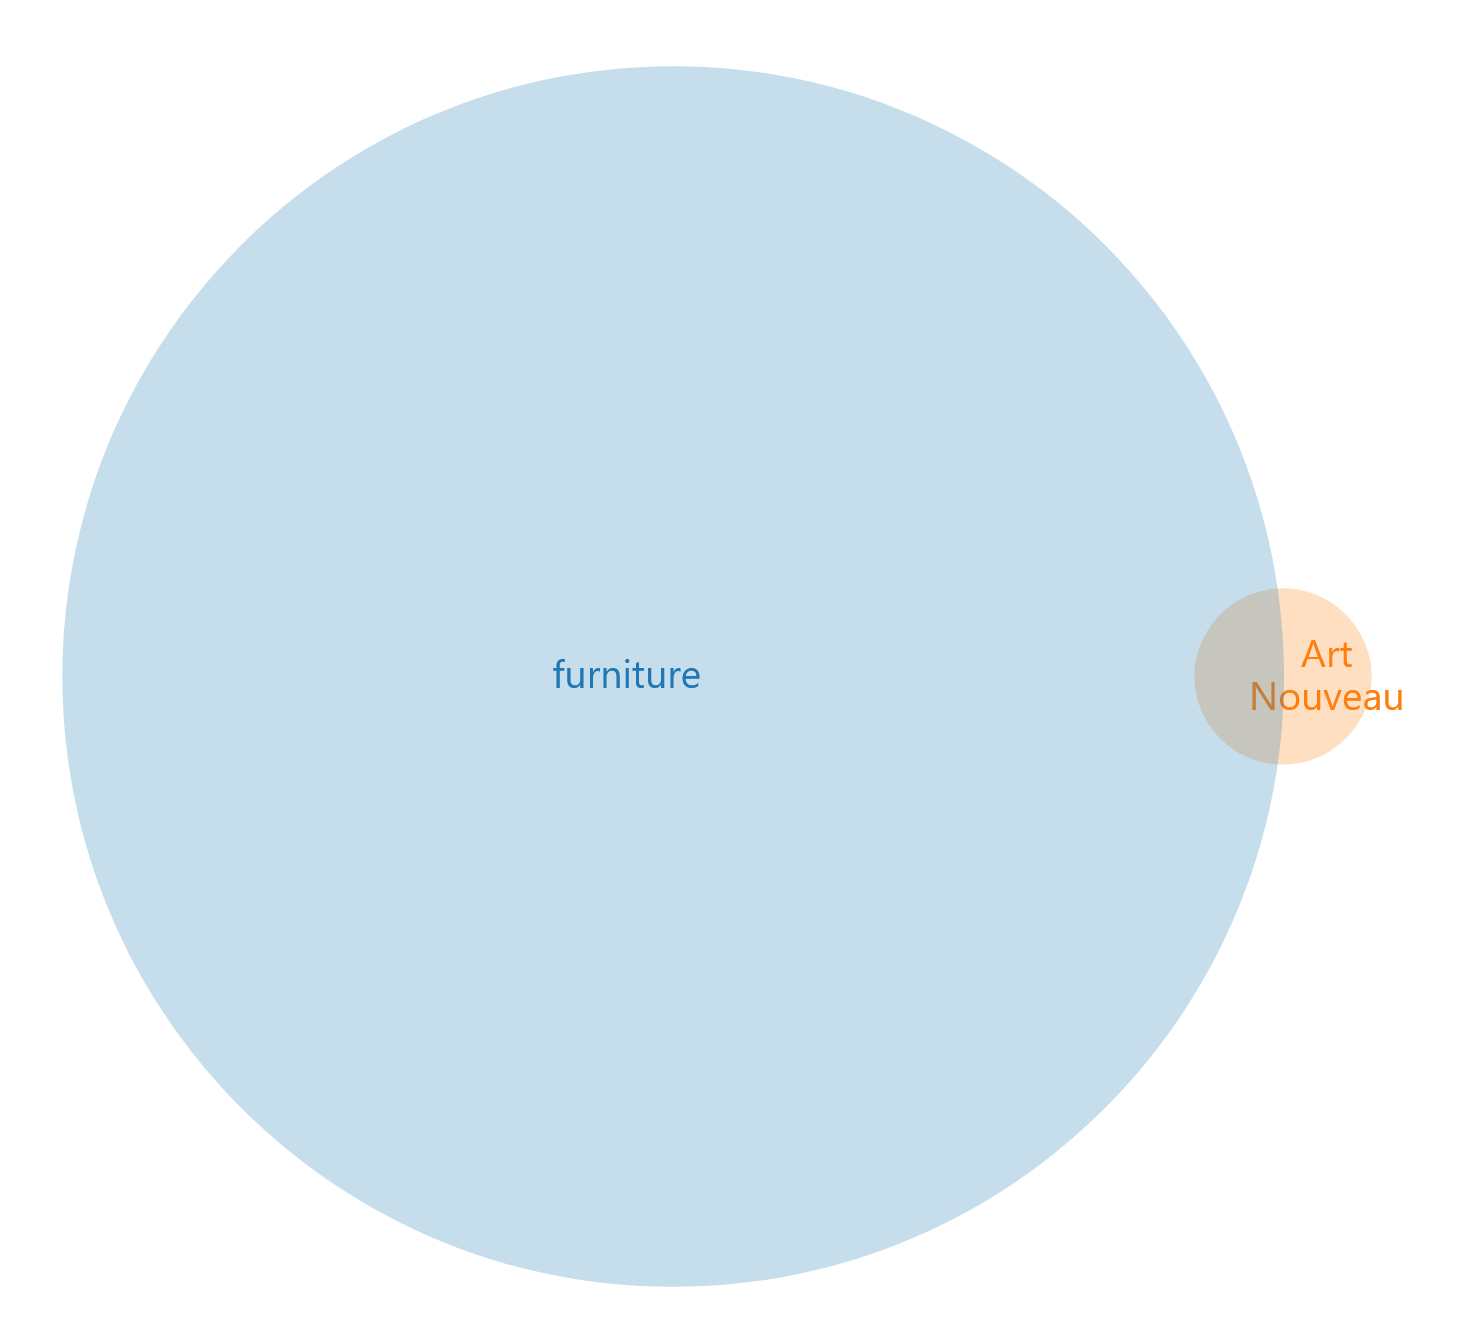
Much like Search Workbench, it also uses Venn diagrams to illustrate how parts of complex search relate to one another. For example, if someone were to search using Boolean logic for “Art Nouveau AND furniture”:

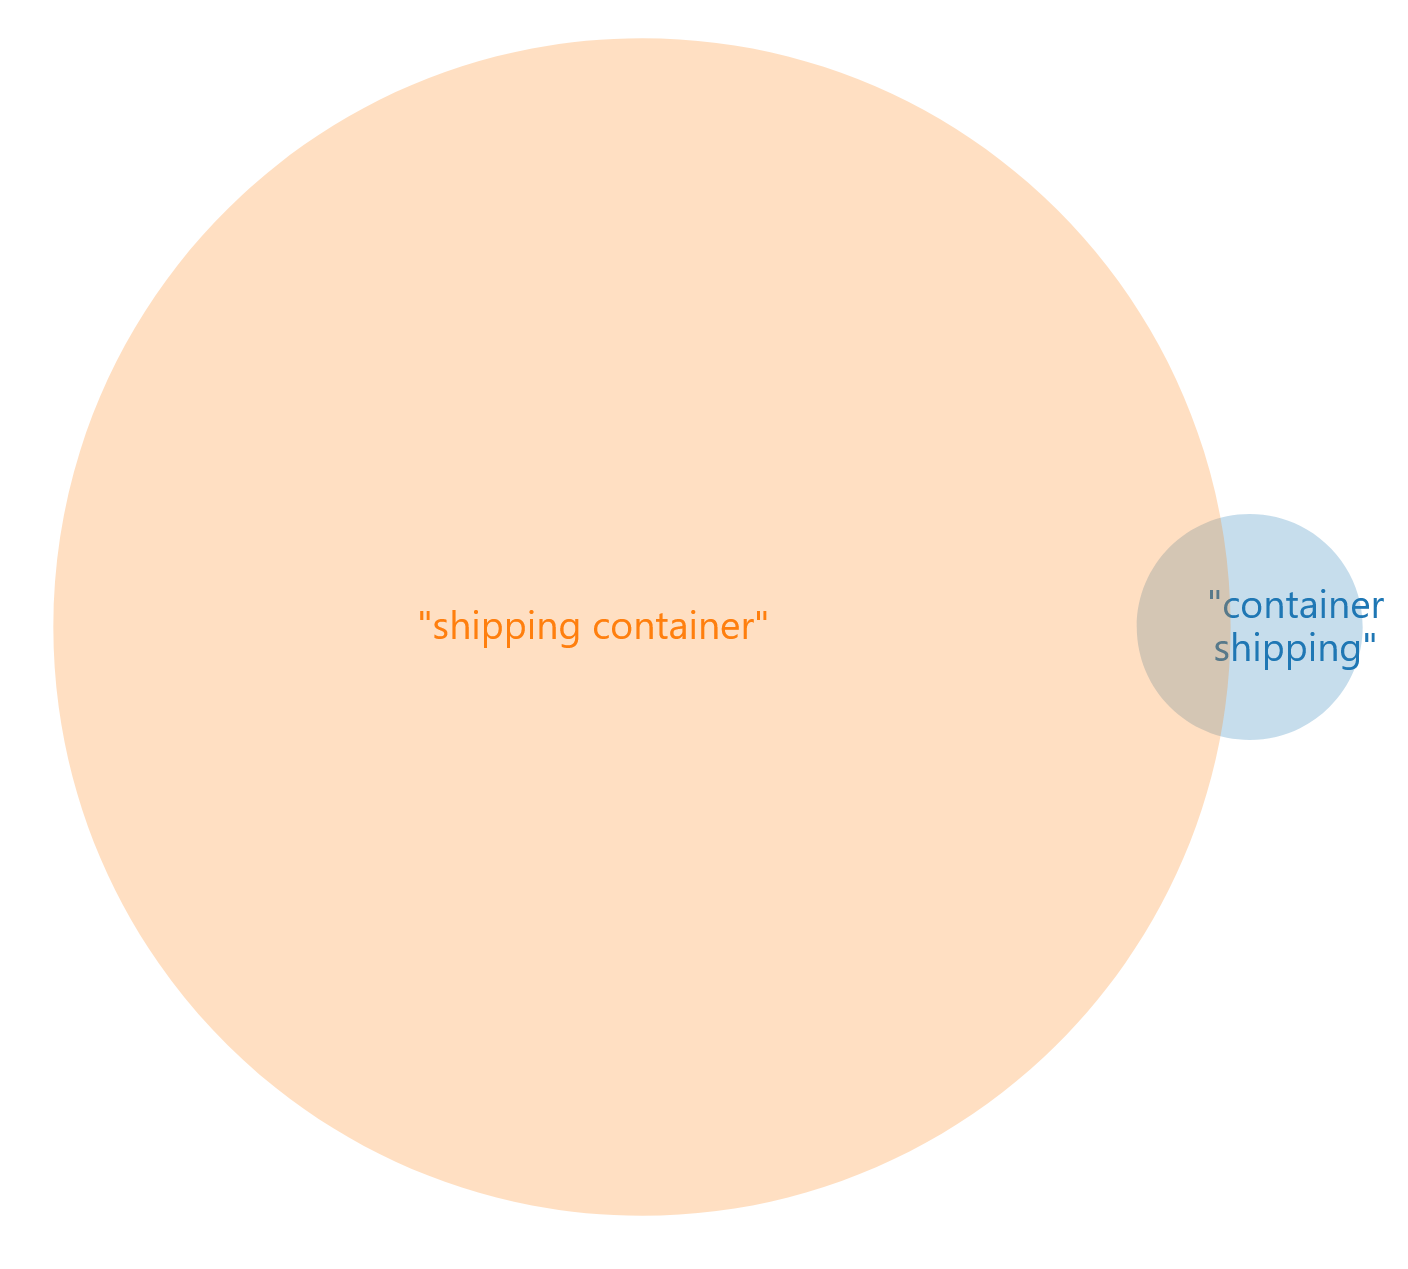
Crucially, it also (as Search Workbench does) allows you to visually compare multiple searches to one another, facilitating the process of refining a complex search strategy. For example, the results returned by the search “container shipping” are not at all the same as those found with “shipping container”:
Collection View uses the Library of Congress API maintained by LC Labs, so any search that runs against their database can be visualized! As always, let me know if you have any questions or comments.
